Construction Cost Management
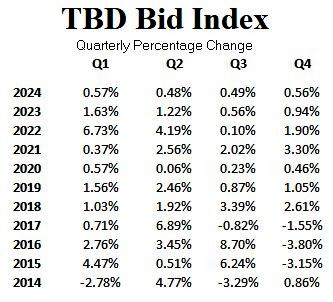
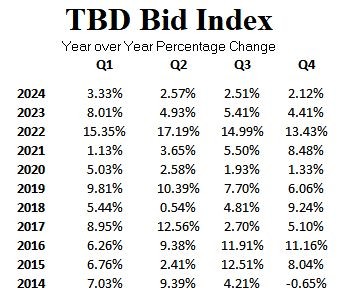
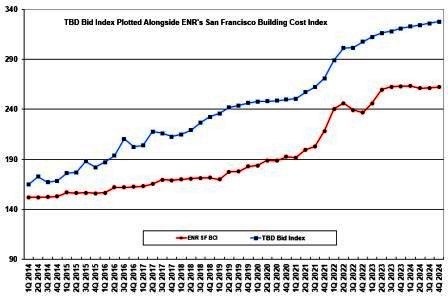
TBD Bid Index
| | Q1 | Q2 | Q3 | Q4 |
| 2025 | 332.86 | | | |
| 2024 | 322.75 | 324.31 | 325.91 | 327.73 |
| 2023 | 312.36 | 316.17 | 317.93 | 320.91 |
| 2022 | 289.20 | 301.32 | 301.62 | 307.35 |
| 2021 | 250.71 | 257.12 | 262.31 | 270.97 |
| 2020 | 247.90 | 248.06 | 248.64 | 249.78 |
| 2019 | 236.02 | 241.83 | 243.94 | 246.49 |
| 2018 | 214.93 | 219.06 | 226.49 | 232.40 |
| 2017 | 203.85 | 217.89 | 216.10 | 212.74 |
| 2016 | 187.11 | 193.57 | 210.42 | 202.42 |
| 2015 | 176.08 | 176.97 | 188.02 | 182.09 |
| 2014 | 164.93 | 172.80 | 167.11 | 168.54 |
| 2013 | 154.10 | 157.96 | 160.36 | 169.65 |
| 2012 | 145.13 | 151.21 | 150.72 | 153.01 |
| 2011 | 131.12 | 136.27 | 140.09 | 140.42 |
| 2010 | 118.49 | 124.70 | 121.98 | 123.93 |
| 2009 | 131.16 | 120.71 | 116.92 | 116.74 |
| 2008 | 159.82 | 154.15 | 158.43 | 139.47 |
| 2007 | 153.88 | 157.20 | 163.20 | 161.68 |
| 2006 | 137.80 | 138.93 | 143.36 | 152.65 |
| 2005 | 118.39 | 121.04 | 128.06 | 138.09 |
| 2004 | 107.62 | 109.17 | 112.33 | 116.33 |
| 2003 | 100.00 | 100.10 | 104.60 | 105.58 |